7 best session replay tools for mobile apps (iOS & Android)
Aug 05, 2024

On this page
- 1. LogRocket
- What is LogRocket?
- How much does LogRocket cost?
- Why do companies use LogRocket?
- 2. UXCam
- What is UXCam?
- How much does UXCam cost?
- Why do companies use UXCam?
- 3. Microsoft Clarity
- What is Microsoft Clarity?
- How much does Microsoft Clarity cost?
- Why do companies use Microsoft Clarity?
- 4. PostHog
- What is PostHog?
- How much does PostHog cost?
- Why do companies use PostHog?
- 5. Smartlook
- What is Smartlook?
- How much does Smartlook cost?
- Why do companies use Smartlook?
- 6. FullStory
- What is FullStory?
- How much does FullStory cost?
- Why do companies use FullStory?
- 7. Contentsquare
- What is Contentsquare?
- How much does Contentsqaure cost?
- Why do companies use Contentsquare?
- Further reading
1. LogRocket
Typical users: Product managers, engineers, support teams

What is LogRocket?
LogRocket is a product experience platform that focuses on helping product managers, engineers, and support teams fix issues. In addition to session replay, it provides tools to identify the most impactful issues, such as crash reports, stack traces, performance monitoring, and product analytics.
Supported features
| LogRocket | |
Supported platforms Mobile platforms where session replay is available | Android, iOS, React Native |
Debug logs View console logs, network logs | ✔ |
Filters View specific replays based on user segments, screens visited, events | ✔ |
Heatmaps Highlight areas that get the most interaction | ✔ |
Scroll maps See how far users scroll and where they dwell | ✔ |
Rage taps Identify repetitive taps made out of frustration | ✔ |
Dead taps Detect taps on elements that do not respond or trigger an action | ✔ |
Crash reports Learn what happens before a crash without complex debugging or reproduction | ✔ |
AI summaries Generate summaries of session replays | ✔ |
How much does LogRocket cost?
Its Team plan starts at $199/month for up to 10k sessions and includes most session replay features, but excludes other features such as product analytics and some error tracking features.
The Professional plan starts at $420/month for up to 10k sessions and includes all their features, but requires an annual commitment.
Why do companies use LogRocket?
Reviewers on G2 use LogRocket for:
Identifying problems: LogRocket's combination of error tracking, performance monitoring, and session replay makes it uniquely powerful at finding bugs and issues.
Improves user experience: LogRocket helps reviews fix issues with their apps. Reviewers find it provides all the tools to improve their user experience, mostly by solving what's wrong rather than feedback and planning.
High usability: LogRocket provides a lot of functionality out of the box. It captures the details users need, provides useful visualizations, and automatically triages some issues.
Bottom line
LogRocket is great choice for teams whose top priority is identifying and mitigating issues.
2. UXCam
Typical users: Product managers in enterprise companies

What is UXCam?
UXCam is a platform built solely for mobile apps. It includes a full-suite of analytics features as well as session replays, heatmaps, and crash analytics.
It's designed to provide deep insights into user behavior, helping product managers understand how users interact with their apps.
Supported features
| UXCam | |
Supported platforms Mobile platforms where session replay is available | Android, iOS, React Native, Flutter |
Debug logs View console logs, network logs | ✔ |
Filters View specific replays based on user segments, screens visited, events | ✔ |
Heatmaps Highlight areas that get the most interaction | ✔ |
Scroll maps See how far users scroll and where they dwell | ✔ |
Rage taps Identify repetitive taps made out of frustration | ✔ |
Dead taps Detect taps on elements that do not respond or trigger an action | ✔ |
Crash reports Learn what happens before a crash without complex debugging or reproduction | ✔ |
AI summaries Generate summaries of session replays | ✖ |
How much does UXCam cost?
UXCam's pricing is sales-driven and completely opaque, so it's not clear how much it costs. The company's sales team will give you a quote after you've spoken to them.
Why do companies use UXCam?
Looking at G2 reviews, companies choose UXCam to:
Insights on user behavior: Shows what they are doing, where their attention is going, and how they are spending their time. Users love the realizations they get with UXCam's tools.
It's easy to use: Reviewers note how easy UXCam is to set up and use. This means they can go from idea to actionable learnings quickly.
Heatmaps and scrollmaps: Seeing clicks and scroll depth works well and creates actionable insights for design and product teams. Helps improve UX and page designs.
Bottom line
UXCam is ideal for product managers who need in-depth insights into user behavior. Despite opaque pricing, its ease of use and actionable insights make it a valuable tool.
3. Microsoft Clarity
Typical users: Marketing and content teams

What is Microsoft Clarity?
Microsoft Clarity is a 100% free session replay tool that supports most replay features and heatmaps. It integrates with Google Analytics 4, so you can view your GA data in Clarity.
It includes most of the session replay features you would expect, but doesn't support any additional features that some of the other choices on this list do, like crash reports or debug logs.
Supported features
| Microsoft Clarity | |
Supported platforms Mobile platforms where session replay is available | Android, iOS, React Native |
Debug logs View console logs, network logs | ✖ |
Filters View specific replays based on user segments, screens visited, events | ✔ |
Heatmaps Highlight areas that get the most interaction | ✔ |
Scroll maps See how far users scroll and where they dwell | ✔ |
Rage taps Identify repetitive taps made out of frustration | ✔ |
Dead taps Detect taps on elements that do not respond or trigger an action | ✔ |
Crash reports Learn what happens before a crash without complex debugging or reproduction | ✖ |
AI summaries Generate summaries of session replays | ✔ |
How much does Microsoft Clarity cost?
Clarity is completely free.
Why do companies use Microsoft Clarity?
According to reviews on G2 and Capterra, it's because:
It's easy to set up and use: Setting up Clarity doesn't require much technical knowledge and users mostly like the simple user interface.
It helps uncover how users navigate: Clarity users are mostly using it to understand how people navigate their app and identify opportunities for improvement.
It's free: The short 30-day retention limit is easy to forgive when it's free.
Bottom line
If you only care about session replay and dont need other features, Clarity is the obvious choice - especially if you're already using Google Analytics. On the other hand, software engineers will find Clarity's lack of debug logs disappointing.
4. PostHog
Typical users Engineering and product teams

What is PostHog?
PostHog (that's us 👋) is an all-in-one platform built to help engineers create better products. It includes session replays and a whole bunch more, such as product analytics, A/B testing, and feature flags.
It's designed for product-minded engineers, growth teams, and product managers who need to move fast and iterate based on reliable, actionable insights.
Supported features
| PostHog | |
Supported platforms Mobile platforms where session replay is available | Android, iOS, React Native, Flutter |
Debug logs View console logs, network logs | ✔ |
Filters View specific replays based on user segments, screens visited, events | ✔ |
Heatmaps Highlight areas that get the most interaction | ✖ |
Scroll maps See how far users scroll and where they dwell | ✖ |
Rage taps Identify repetitive taps made out of frustration | ✖ |
Dead taps Detect taps on elements that do not respond or trigger an action | ✖ |
Crash reports Learn what happens before a crash without complex debugging or reproduction | ✖ |
AI summaries Generate summaries of session replays | ✖ |
How much does PostHog cost?
PostHog has transparent pricing based on usage. It’s free to get started and completely free for the first 2,500 mobile recordings and 5,000 web ones per month. After this, pricing starts at $0.0100 per mobile recording, and recordings cost progressively less the more you use. This makes PostHog significantly cheaper than all the other companies on this list (apart from Microsoft Clarity).
Why do companies use PostHog?
According to G2 reviews, companies use PostHog because:
It's many tools in one: PostHog can replace tools like Mixpanel (analytics), UXCam (session replay), and Statsig (A/B testing and feature flags). This simplifies workflows and ensures all product data is in one place.
They need a complete picture of users: PostHog includes every tool necessary to understand users and build better products. This means creating funnels to track conversion, watching replays to see where users get stuck, and testing solutions with A/B tests.
Pricing is transparent and scalable: Reviewers appreciate how PostHog's pricing scales as they grow. There's a generous free tier. Companies eligible for PostHog for Startups also get $50k in additional free credits.
Bottom line
For teams looking for all the tools they need to improve their products, PostHog makes for a great choice. This is especially true for startups and scaleups thanks to it having a generous free tier.
5. Smartlook
Typical users: Engineers, business analysts, product managers

What is Smartlook?
Smartlook combines session replays, product analytics, visualizations, and crash reports to generate an overall understanding of user experience. It focuses on mobile apps with specific tools like native rendering and wireframe mode.
Supported features
| Smartlook | |
Supported platforms Mobile platforms where session replay is available | Android, iOS, React Native, Flutter |
Debug logs View console logs, network logs | ✔ |
Filters View specific replays based on user segments, screens visited, events | ✔ |
Heatmaps Highlight areas that get the most interaction | ✔ |
Scroll maps See how far users scroll and where they dwell | ✔ |
Rage taps Identify repetitive taps made out of frustration | ✔ |
Dead taps Detect taps on elements that do not respond or trigger an action | ✔ |
Crash reports Learn what happens before a crash without complex debugging or reproduction | ✔ |
AI summaries Generate summaries of session replays | ✖ |
How much does Smartlook cost?
Smartlook's free plan records up to 3k sessions and includes most of their replay features. Its pro plan includes all replay features and starts at $69/month for 5k sessions or $99 for 10k sessions. Pricing becomes progressively cheaper with more monthly sessions.
Why do companies use Smartlook?
According to G2 reviewers, Smartlook users benefit from:
The integration between replays and events: Smartlook connects event-based analytics and sessions. This enables users to dive deeper into user behavior than a single tool provides.
Understanding visitor pain points: The analytics and visualizations make it easy to understand where users are running into trouble. Reviews use this to improve the user experience and conversion in these areas.
Real user monitoring: Smartlook shows how real users are using your app and monitors the quality of their experiences. Reviewers use it to figure out what areas are confusing or used improperly.
Bottom line
Smartlook's combination of analytics, session replay, and crash reports make it a good choice for teams who want a full picture of their user experience.
6. FullStory
Typical users: Product managers, customer success, and support
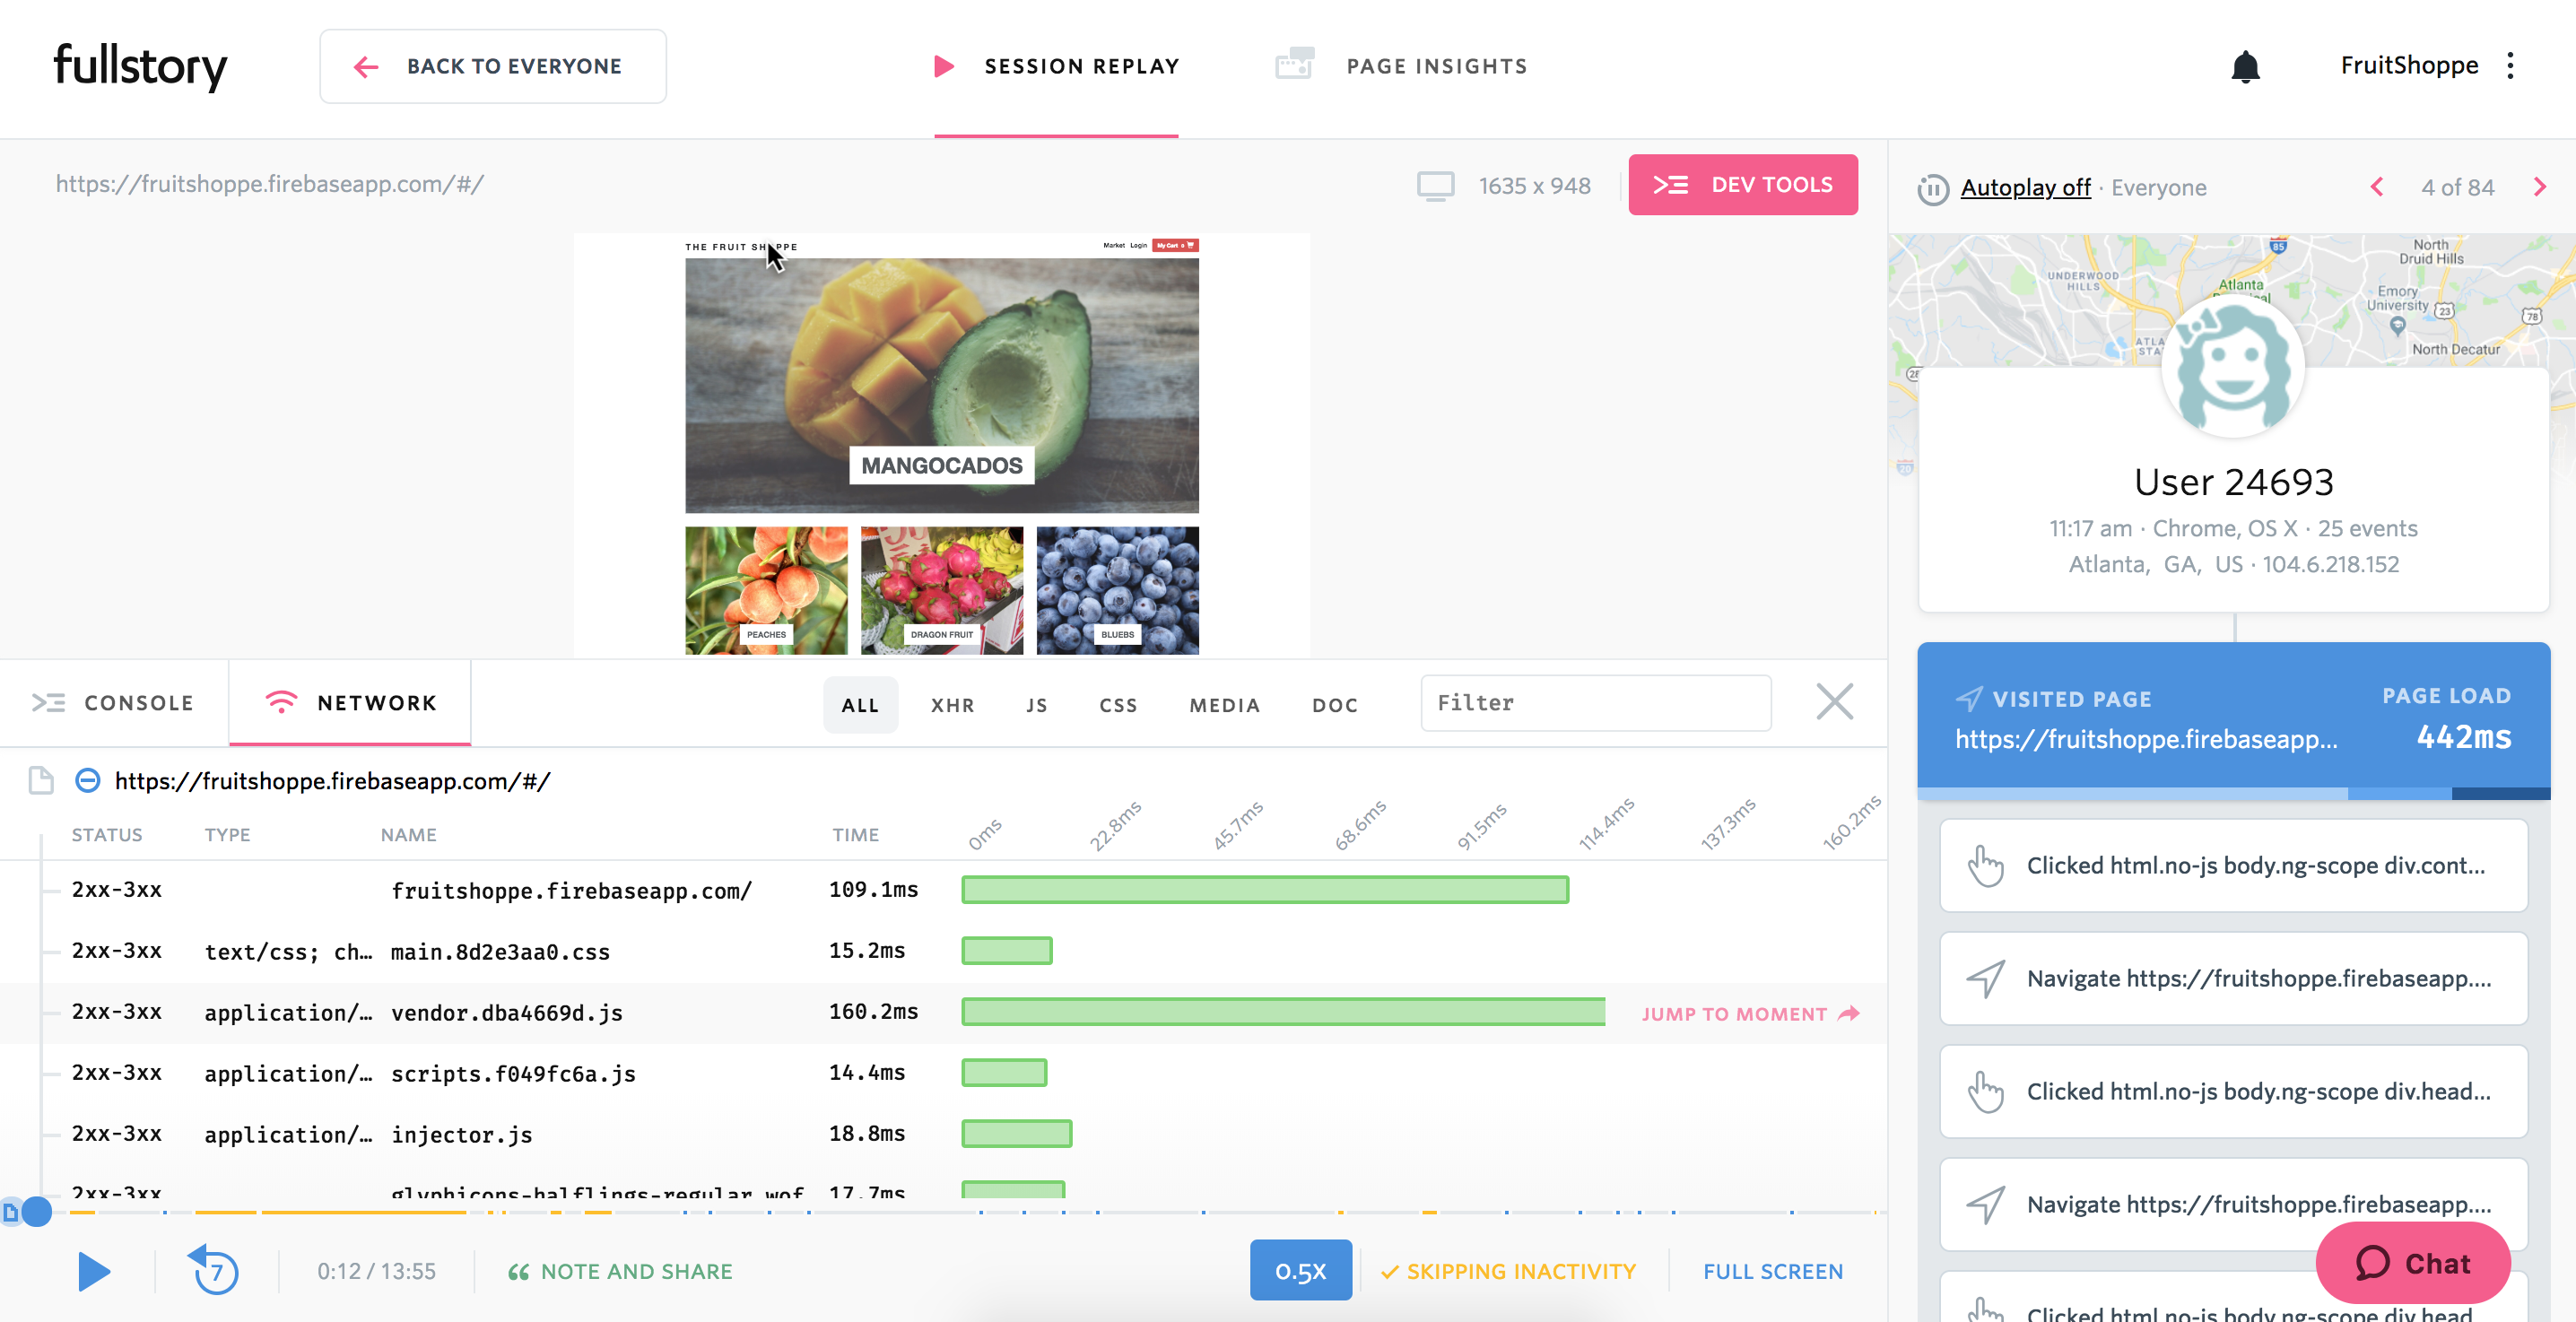
What is FullStory?
FullStory describes itself as behavioral data analytics platform, which is code for session replay and mobile app analytics, with a side of product analytics.
Supported features
| FullStory | |
Supported platforms Mobile platforms where session replay is available | Android, iOS, React Native, Flutter |
Debug logs View console logs, network logs | ✔ |
Filters View specific replays based on user segments, screens visited, events | ✔ |
Heatmaps Highlight areas that get the most interaction | ✔ |
Scroll maps See how far users scroll and where they dwell | ✔ |
Rage taps Identify repetitive taps made out of frustration | ✔ |
Dead taps Detect taps on elements that do not respond or trigger an action | ✔ |
Crash reports Learn what happens before a crash without complex debugging or reproduction | ✖ |
AI summaries Generate summaries of session replays | ✖ |
How much does FullStory cost?
FullStory doesn't publish pricing publicly. However, according to Failory, Fullstory will cost you between $250 - $1,000 per month.
Why do companies use FullStory?
According to reviews on G2, companies use FullStory for:
Easier collaboration: As an accessible tool for non-technical users, FullStory facilitates collaboration between product, UX, and engineering teams by allowing all teams to access useful, reliable data.
Viewing user issues: Support teams use FullStory to replay sessions to understand user hard-to-replicate problems, and identify bugs that need fixing.
Improving conversion: FullStory users like to combine funnel insights with replays of user sessions to understand pain points and improve conversion.
Bottom line
For a complete behavioral analytics suite, FullStory is a solid choice. Users wanting more features, like error tracking or A/B testing should switch to other choices.
7. Contentsquare
Typical users: Product managers, ecommerce teams, and marketers
What is Contentsquare?
Contentsquare is an analytics platform that combines heatmaps, customer journey analysis, and frustration scoring to help find and fix issues and friction points.
Supported features
| Contentsquare | |
Supported platforms Mobile platforms where session replay is available | Android, iOS, React Native |
Debug logs View console logs, network logs | ✔ |
Filters View specific replays based on user segments, screens visited, events | ✔ |
Heatmaps Highlight areas that get the most interaction | ✔ |
Scroll maps See how far users scroll and where they dwell | ✔ |
Rage taps Identify repetitive taps made out of frustration | ✔ |
Dead taps Detect taps on elements that do not respond or trigger an action | ✖ |
Crash reports Learn what happens before a crash without complex debugging or reproduction | ✔ |
AI summaries Generate summaries of session replays | ✖ |
How much does Contentsqaure cost?
Since Contentsquare caters mostly to enterprise companies, its pricing is not available publicly and you need to speak to its sales team to get a quote. According to Capterra, pricing starts at $10,000/month, but no further information is given
Why do companies use Contentsquare?
According to G2 reviews, people like Contentsquare because:
Data visualization and analysis: Users like that Contentsquare makes it easy to visualize and analyze large data sets. Advanced features make it easier to identify and fix problems big and small.
Improve your UI and UX: Contentsquare makes it easy to understand the impact of various design elements on a screen. This helps developers understand the impact of elements on conversion rate, revenue, and user journeys.
Detailed session replays: Users appreciate being able to match quantitative data with qualitative data, giving them a better understanding of how best to solve problems.
Bottom line
From data visualizations, to behavior analysis, and detailed session replays, Contentsquare has a lot to offer, especially for larger companies.
Further reading
- The 9 best mobile app A/B testing tools
- The 7 best mobile app analytics tools
- The best UXCam alternatives & competitors, compared